Choosing quality control equipment in 2026 requires more than comparing prices and product brochures. Manufacturing teams now face tighter tolerances, faster production cycles, and growing pressure to document every inspection result. The right equipment should support accurate decisions, not simply produce impressive numbers.
A practical evaluation begins with the inspection task. Consider measurement range, repeatability, resolution, operating speed, and environmental conditions. A device used beside a warm machining line may behave differently from one used in a controlled laboratory. Calibration certificates, traceable standards, software validation, and secure data storage also deserve close attention. These details often determine whether results remain credible during internal reviews or customer audits.
Supplier expertise matters as much as hardware quality. Experienced vendors should explain limitations, maintenance needs, training requirements, and integration risks without hiding behind technical language. Independent test reports and references from similar facilities can strengthen the decision. However, no checklist is perfect. A highly automated system may reduce manual errors while creating new cybersecurity or data-management concerns. A lower-cost instrument may perform well but require more frequent verification. Teams should test shortlisted equipment with real samples, including difficult parts and borderline defects. Small trials reveal practical problems that specifications overlook. Review decisions regularly. Quality requirements change, and equipment choices may need to change with them.
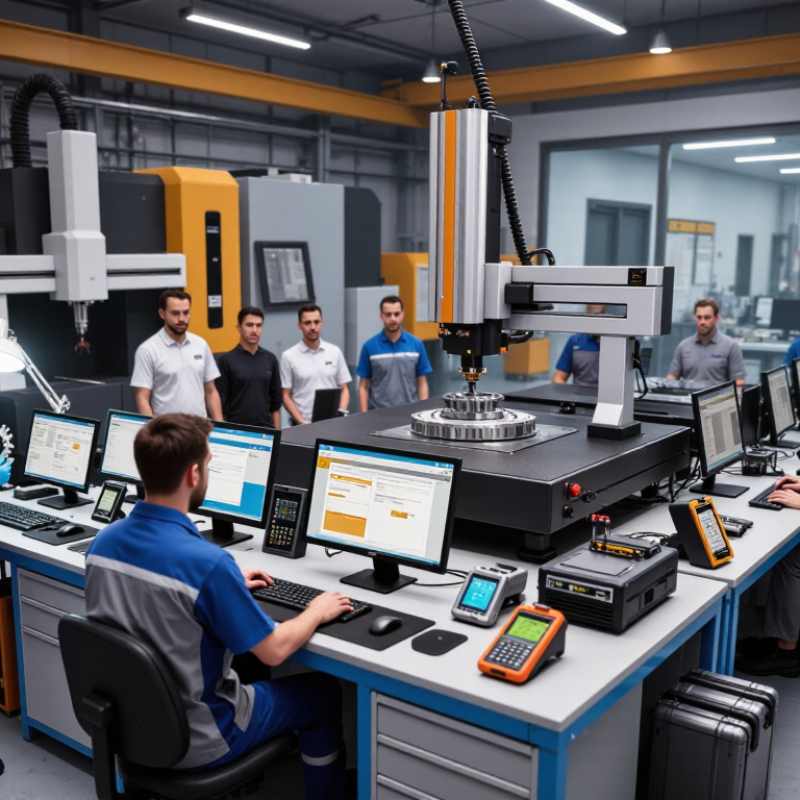
How to Choose Quality Control Equipment in 2026?
Choosing quality control equipment in 2026 should begin with product requirements, not catalog features. Define measurable goals: defect rate, dimensional tolerance, inspection speed, traceability, and operator safety. Start with function. A molded seal may need diameter accuracy within 0.05 millimeters. A coated panel may require adhesion and surface coverage data. Equipment must detect the failure that matters under actual production conditions. Teams often specify accuracy before defining the decision. That is backwards.
The ISO Survey 2023 recorded 1,265,216 valid ISO 9001 certificates worldwide. This scale shows why consistent inspection evidence matters across suppliers and production sites. The 2024 World Quality Report found that 68% of surveyed organizations viewed artificial intelligence as a major quality engineering priority. However, advanced software cannot repair unclear acceptance criteria. Define the product’s critical characteristics first. Then connect each characteristic to a measurement method, sampling frequency, and documented tolerance.
Test equipment with representative samples, including borderline and intentionally imperfect parts. Measure repeatability and reproducibility, not only headline accuracy. A camera may detect scratches well, yet miss shallow dents under uneven lighting. Calibration records, environmental limits, data export, and operator training also belong in the requirement sheet. Leave room for doubt. A requirement that looks precise may still ignore temperature drift, fixture wear, or rushed inspections. Validate the complete process before approving the purchase. (Sources: ISO Survey 2023; World Quality Report 2024)
| Quality Control Goal | Recommended Equipment Type | Key Product Requirement | Typical Measurement Range | Typical Accuracy or Resolution | Recommended Throughput | Important Selection Criteria |
|---|---|---|---|---|---|---|
| Dimensional inspection | Coordinate measuring machine or vision measurement system | Tolerances, part size, datum structure, and geometric features | Approximately 100 mm to 1,500 mm working envelope | About 1–10 μm repeatability for precision systems | 1–20 parts per hour for detailed inspection | Probe or camera configuration, temperature compensation, fixturing, software capability, and calibration traceability |
| Surface defect detection | Automated optical inspection system | Defect size, contrast, surface finish, and inspection speed | Field of view commonly 25–500 mm | Pixel-level detection may range from approximately 10–100 μm, depending on optics and lighting | Up to several hundred parts per minute in inline applications | Lighting uniformity, camera resolution, false-reject rate, algorithm validation, and product positioning |
| Material composition verification | X-ray fluorescence or optical emission analyzer | Material type, alloy family, coating composition, and detection limits | Element-dependent; commonly major elements to trace concentrations | Often approximately 0.01–0.1% for selected elements under controlled conditions | 10 seconds to several minutes per sample | Required element list, sample geometry, surface preparation, safety controls, and reference standards |
| Hardness verification | Rockwell, Vickers, Brinell, or microhardness tester | Material hardness scale, thickness, geometry, and surface condition | Scale-specific; from low-load microhardness to high-load bulk testing | Resolution commonly 0.1 hardness unit or better, depending on method | Approximately 10–60 seconds per test | Correct test scale, indenter condition, force control, specimen support, and certified reference blocks |
| Tensile and mechanical performance | Universal testing machine | Maximum load, force accuracy, displacement range, and test speed | Typically 1 kN to 1,000 kN, selected by specimen and material | Force accuracy commonly within ±0.5% of indicated load for calibrated systems | Several minutes per specimen, depending on the standard | Load-cell capacity, grip design, extensometer accuracy, test method, and emergency protection |
| Leak and pressure testing | Pressure decay, vacuum decay, mass-flow, or helium leak tester | Allowable leakage, test pressure, stabilization time, and product volume | From low-pressure pneumatic tests to high-pressure applications | Leak-rate sensitivity may range from approximately 10-3 to 10-9 pressure-volume units per second, depending on method | 1–30 seconds per part for automated testing | Fixture sealing, pressure stability, test-medium compatibility, safety enclosure, and calibration method |
| Temperature and humidity validation | Environmental chamber with calibrated sensors | Operating limits, ramp rate, dwell time, humidity level, and chamber volume | Approximately −70°C to +180°C; humidity commonly 10–98% RH | Temperature stability often ±0.5–2°C; humidity stability often ±2–5% RH | Batch-based; cycle duration ranges from hours to weeks | Working volume, thermal uniformity, sample heat load, sensor mapping, energy use, and safety interlocks |
| Electrical safety and performance | Electrical safety analyzer, insulation tester, hipot tester, or power analyzer | Rated voltage, leakage-current limit, insulation resistance, and power range | Application-dependent; commonly up to several kilovolts for dielectric tests | Current resolution may reach microampere levels; resistance ranges may extend into gigaohms | Seconds per test in production environments | Applicable electrical standard, operator protection, automatic discharge, test sequencing, and result logging |
| Surface roughness measurement | Contact or optical surface profilometer | Required roughness parameter, cutoff length, evaluation length, and surface accessibility | Commonly Ra values from approximately 0.02 μm to 50 μm | Vertical resolution may be below 0.01 μm on suitable systems | Seconds to minutes per measurement | Stylus radius or optical resolution, filtering standards, surface curvature, vibration isolation, and operator training |
| Production process monitoring | In-line sensors, statistical process control software, or automated inspection station | Critical process parameters, control limits, sampling frequency, and response time | Defined by the process; may include temperature, force, torque, dimension, or flow | Target capability should generally support a measurement resolution at least 10 times finer than the specification tolerance | Continuous or cycle-by-cycle monitoring | Integration with production controls, alarm management, data security, audit trails, and measurement-system analysis |